Risk Estimation
Configured in
Settings → Risk estimation.
Highway Radar uses crowdsourced historical data for estimating the chance of meeting police at this location, this time, and this day (weekday/weekend). The estimation is solely based on past user reports. The estimation is computed based on the data obtained during the last 365 days.
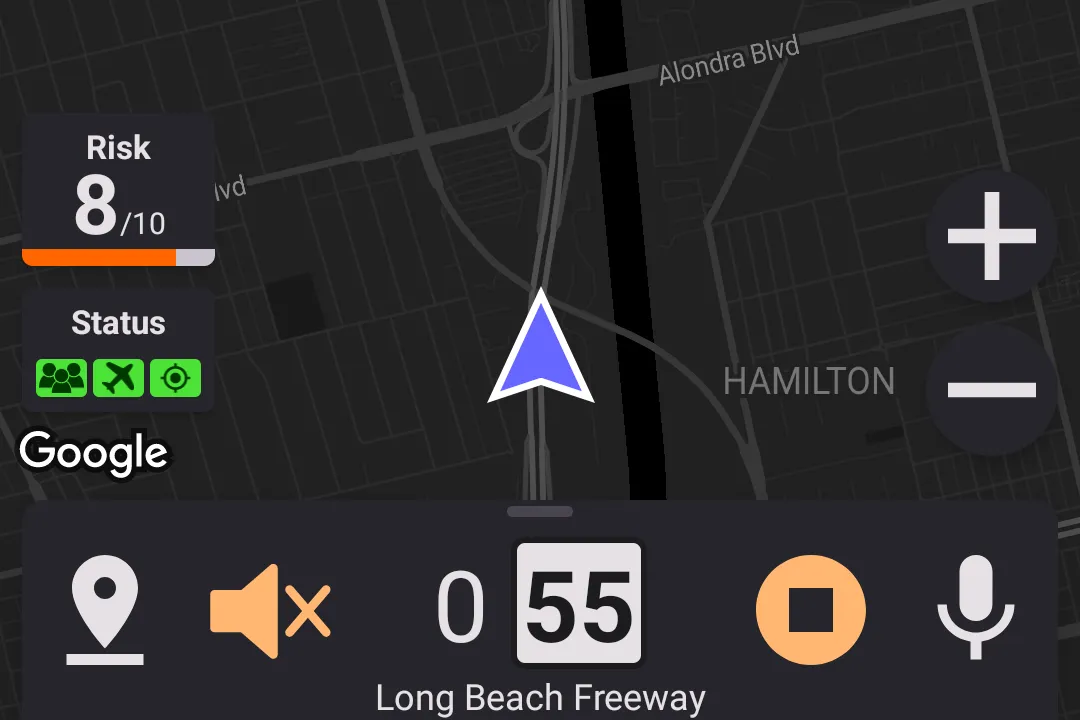
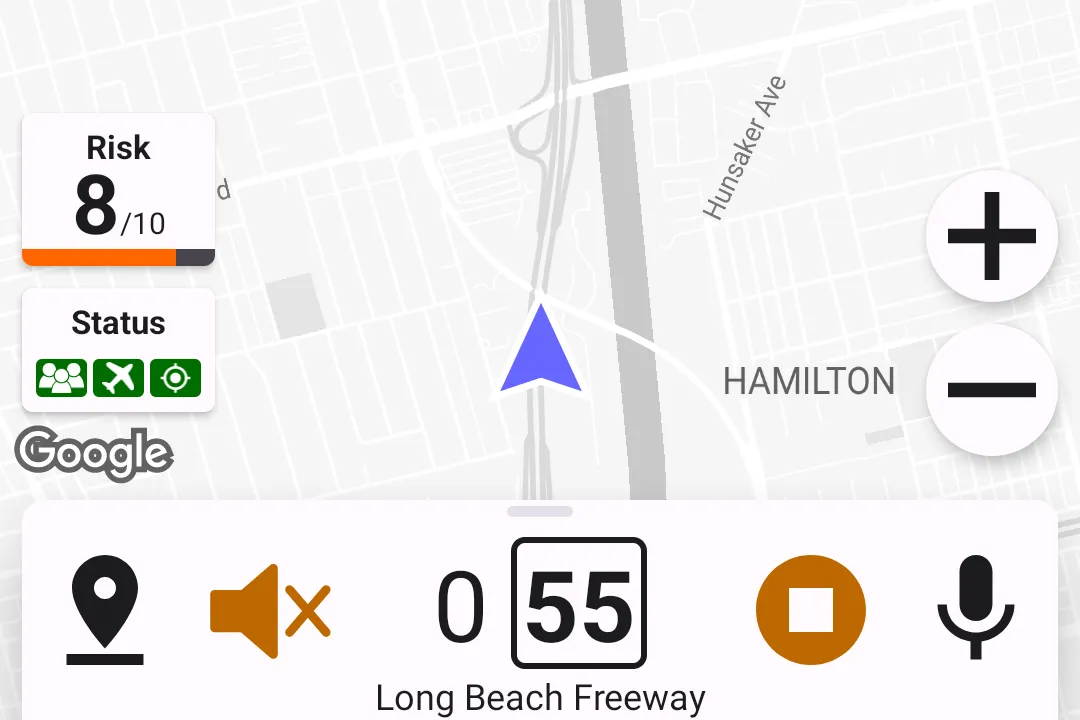
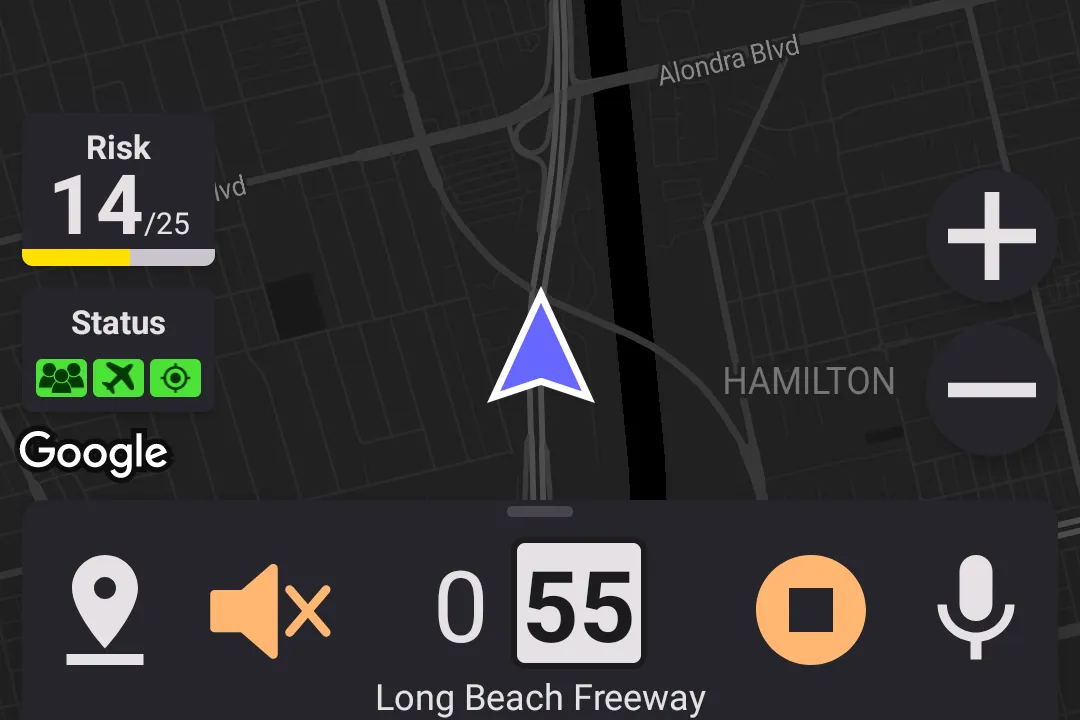
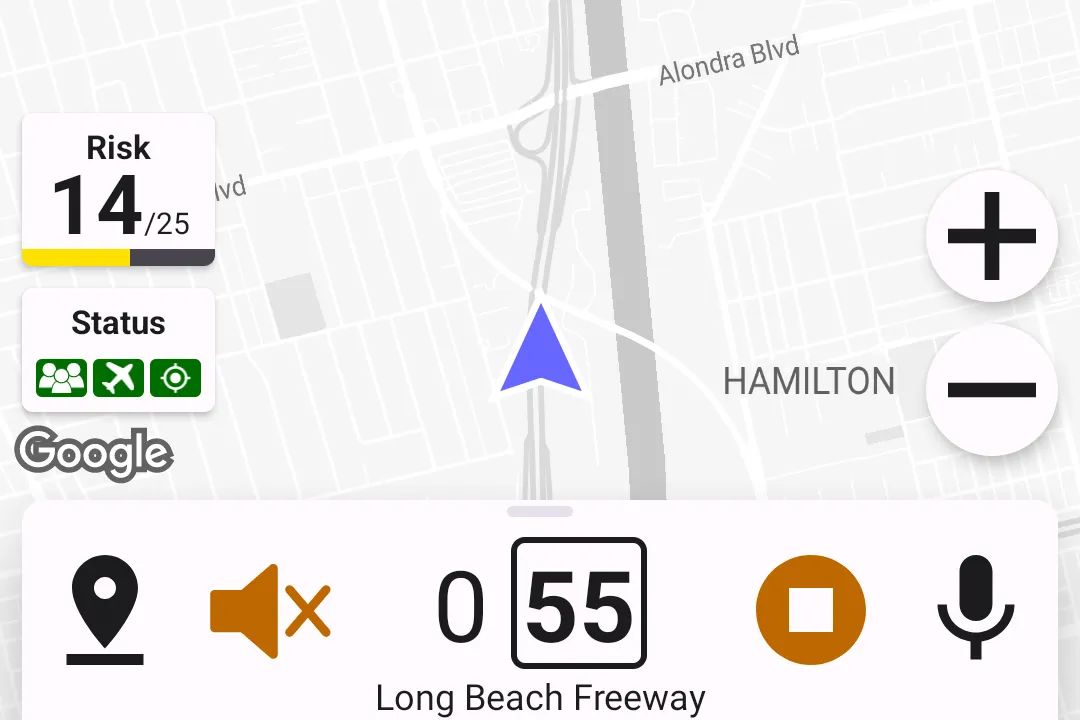
The risk score is shown in the bottom left side of the app, inside the "Risk" widget.
Interpreting The Data
The estimation value is a number and a probability of having a police report based on location, time, and day. By default only the number is visible. If you tap on the number, you'll see a message with the probabilty.
To make things easier, let's consider a couple of examples.
Say you're getting the following value for the risk score: the widget shows 8/10, and the message says Risk: 8/10 (>70% in 3mi ±1h)
- 8/10 means that there are 10 possible risk levels with your configuration, and this one is 8th (starting from the least risky).
- ±1h means that the estimation is computed for a time window beginning at the current time rounded down to the nearest hour minus 1 hour and ending at the current time rounded up to the nearest hour plus 1 hour. For example, if you see that at
8:32, the estimation would be computed for a timeframe between7:00and10:00. - 3mi means that the estimation is computed for a circle with a radius of 3 miles around your current location.
- >70% means that the probability of encountering at least one alert in the given circle within the given timeframe is between 70% and 100%.
So, overall, if you see the message above say at 8:32 on Sunday, it would mean that
During more than 70% of weekends out of those in the past 365 days, there was at least one police report within 3 miles of your current location between 7:00 and 10:00.
Let's consider another example: Risk 7/10 (40-70% in 3mi ±1h)
This one is similar to the example above, except the probability ranges from 40% to 70%.
So, overall, if you see the message above say at 4:15 on Monday, it would mean that
The number of weekdays out of those in the past 365 days, when there was at least one police report within 3 miles of your current location between 3:00 and 6:00, falls between 40% and 70%.
Another example: Risk 15/25 (~55% in 1.9mi ±1h)
- 15/25 means that there are 25 possible risk levels with your configuration, and this one is 15th (starting from the least risky).
- ±1h means that the estimation is computed for a time window beginning at the current time rounded down to the nearest hour minus 1 hour and ending at the current time rounded up to the nearest hour plus 1 hour.
- 1.9mi means that the estimation is computed for a circle with a radius of 1.9 miles around your current location.
- ~55% means that the probability of encountering at least one alert in the given circle within the given timeframe is close to 55%.
So, overall, if you see the message above say at 7:57 on Wednesday, it would mean that
During approximately 55% of weekdays out of those in the past 365 days, there was at least one police report within 1.9 miles of your current location between 6:00 and 9:00.
One more example: Risk 2/25 (no reports in 5mi ±2h)
- 2/25 means that there are 25 possible risk levels with your configuration, and this one is 2nd (starting from the least risky).
- ±2h means that the estimation is computed for a time window beginning at the current time rounded down to the nearest hour minus 2 hours and ending at the current time rounded up to the nearest hour plus 2 hours.
- 5mi means that the estimation is computed for a circle with a radius of 5 miles around your current location.
- no reports means that during the last 365 days, there wasn't a single police report in the given circle within the given timeframe.
So, overall, if you see the message above say at 3:24 on Saturday, it would mean that
There were no police reports in the past 365 days within 1.9 miles of your current location between 1:00 and 6:00 on weekends.
The last example: Risk 0/25 (no reports in 10mi)
In this case, there is no timeframe given. It means there were no reports at all in this area, regardless of the time. Weekdays/weekends are still taken into consideration.
So, overall, if you see the message above on Thursday, it would mean that
There were no police reports in the past 365 days within 10 miles of your current location on weekdays.
Scoring Models
There are two types of risk scores supported by Highway Radar - 10-score and 25-score. The former is easier to interpret, and the latter provides more granularity. Below are the possible risk scores from both models.
10-score Model
- Risk: 1/10 (~0% in 10mi)
- Risk: 2/10 (~0% in 5mi)
- Risk: 3/10 (~0% in 5mi ±2h)
- Risk: 4/10 (<10% in 3mi ±1h)
- Risk: 5/10 (10-20% in 3mi ±1h)
- Risk: 6/10 (20-40% in 3mi ±1h)
- Risk: 7/10 (40-70% in 3mi ±1h)
- Risk: 8/10 (>70% in 3mi ±1h)
- Risk: 9/10 (>80% in 2mi ±1h)
- Risk: 10/10 (>90% in 1mi ±1h)
25-score Model
- Risk 0/25 (no reports in 10mi)
- Risk 1/25 (no reports in 5mi)
- Risk 2/25 (no reports in 5mi ±2h)
- Risk 3/25 (no reports in 3mi ±1h)
- Risk 4/25 (~0% in 3mi ±1h)
- Risk 5/25 (~5% in 2.9mi ±1h)
- Risk 6/25 (~10% in 2.8mi ±1h)
- Risk 7/25 (~15% in 2.7mi ±1h)
- Risk 8/25 (~20% in 2.6mi ±1h)
- Risk 9/25 (~25% in 2.5mi ±1h)
- Risk 10/25 (~30% in 2.4mi ±1h)
- Risk 11/25 (~35% in 2.3mi ±1h)
- Risk 12/25 (~40% in 2.2mi ±1h)
- Risk 13/25 (~45% in 2.1mi ±1h)
- Risk 14/25 (~50% in 2mi ±1h)
- Risk 15/25 (~55% in 1.9mi ±1h)
- Risk 16/25 (~60% in 1.8mi ±1h)
- Risk 17/25 (~65% in 1.7mi ±1h)
- Risk 18/25 (~70% in 1.6mi ±1h)
- Risk 19/25 (~75% in 1.5mi ±1h)
- Risk 20/25 (~80% in 1.4mi ±1h)
- Risk 21/25 (~85% in 1.3mi ±1h)
- Risk 22/25 (~90% in 1.2mi ±1h)
- Risk 23/25 (~95% in 1.1mi ±1h)
- Risk 24/25 (~100% in 1mi ±1h)
- Risk 25/25 (~100% in 0.75mi ±1h)